The Azure Lab Diaries - Detecting EDR Silencers

Hello You#
In this blog, Ayham Assaf and I explore various techniques attackers use to silence Microsoft Defender EDR and how you can detect these stealthy moves with a smart Logic App and key event IDs.

Ways to Silence EDRs#
EDR Silencer#
This tool has been used by adversaries lately, and it simply uses the Windows Filtering Platform (WFP) a kernel-mode filtering engine which works on several layers in the network stack to block traffic from specific applications, all that said it mandates high integrity execution.

The attacker runs EDRSilencer using the blockedr argument to block traffic from all detected EDR processes. Alternatively, the attacker can use the block path argument to block traffic from a specific process by providing its full path.
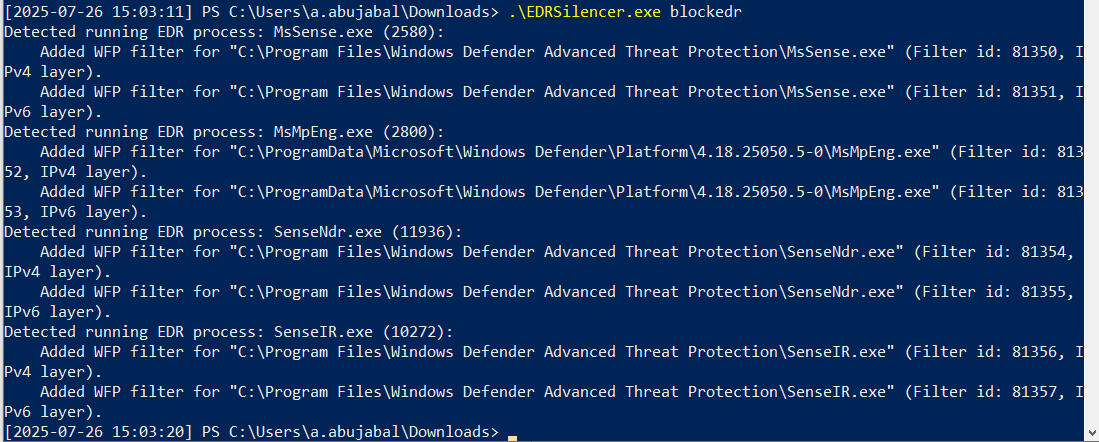
Once the program ran, it checks for the running processes and checks the edrProcess list, then goes to add a block filter in the WFP on that binary.
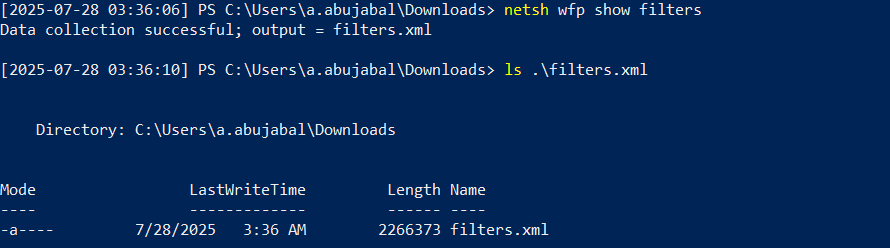
To find the Windows Filtering Platform rules, you need to execute the following command:
netsh wfp show filters
As a result of this command, a filters.xml file will be generated.
You can convert the file to JSON and upload it to Azure Data Explorer or your favorite data analytics platform, for uploading the file to Azure Data Explorer check this article
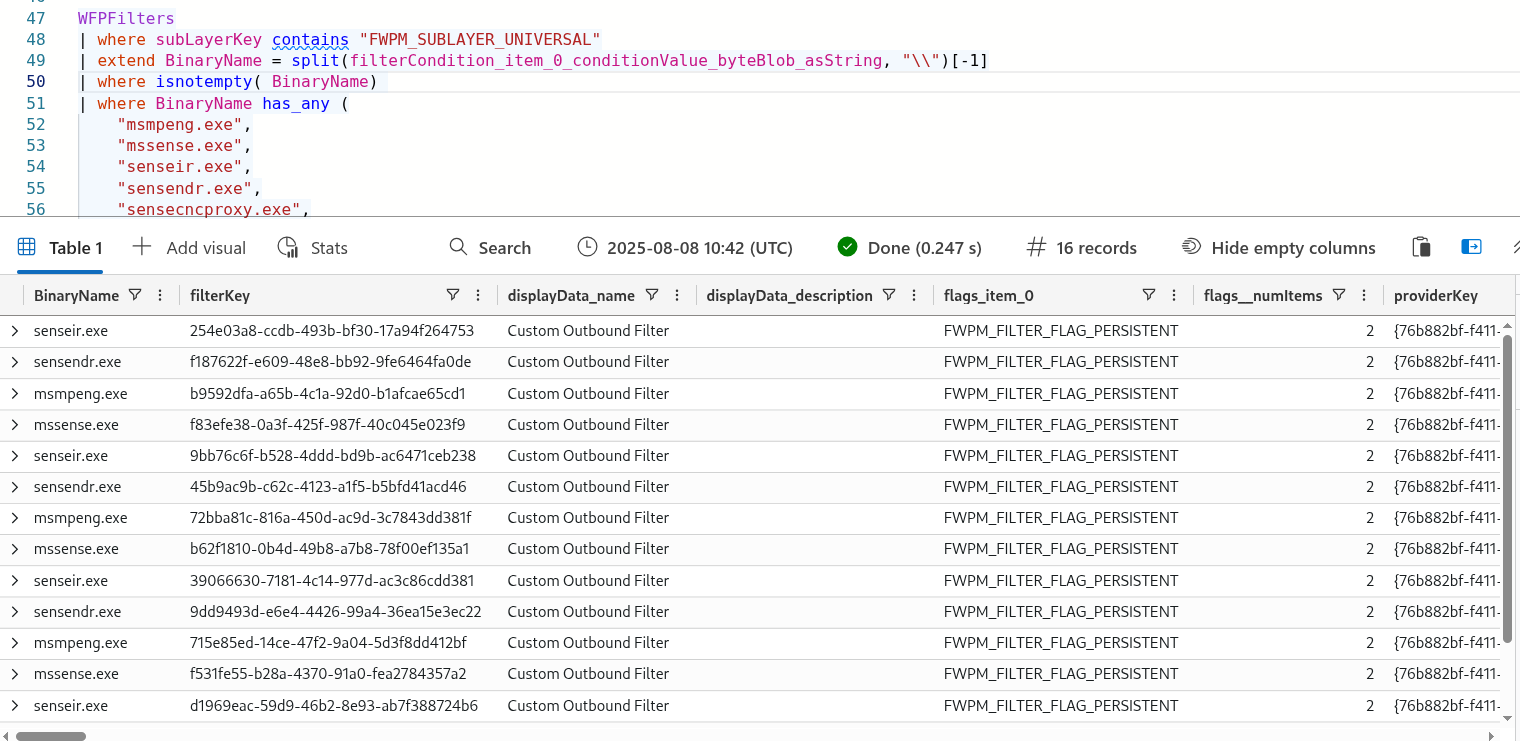
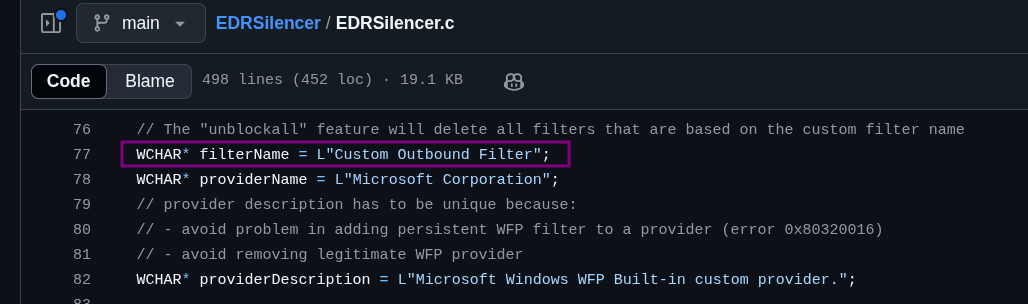
You’ll see that all rules are created with the name Custom Outbound Filter, and the action type FWP_ACTION_BLOCK and the sublayer identifier FWPM_SUBLAYER_UNIVERSAL
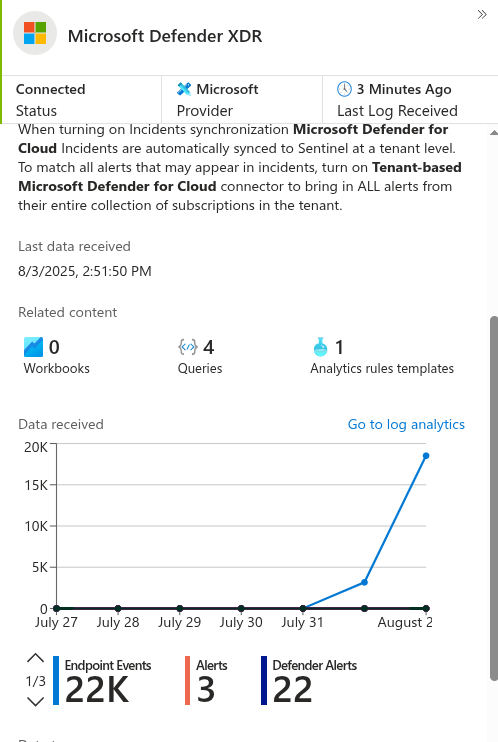
Once we started the EDR Silencer we observed many logs generated in the SENSE/Operational
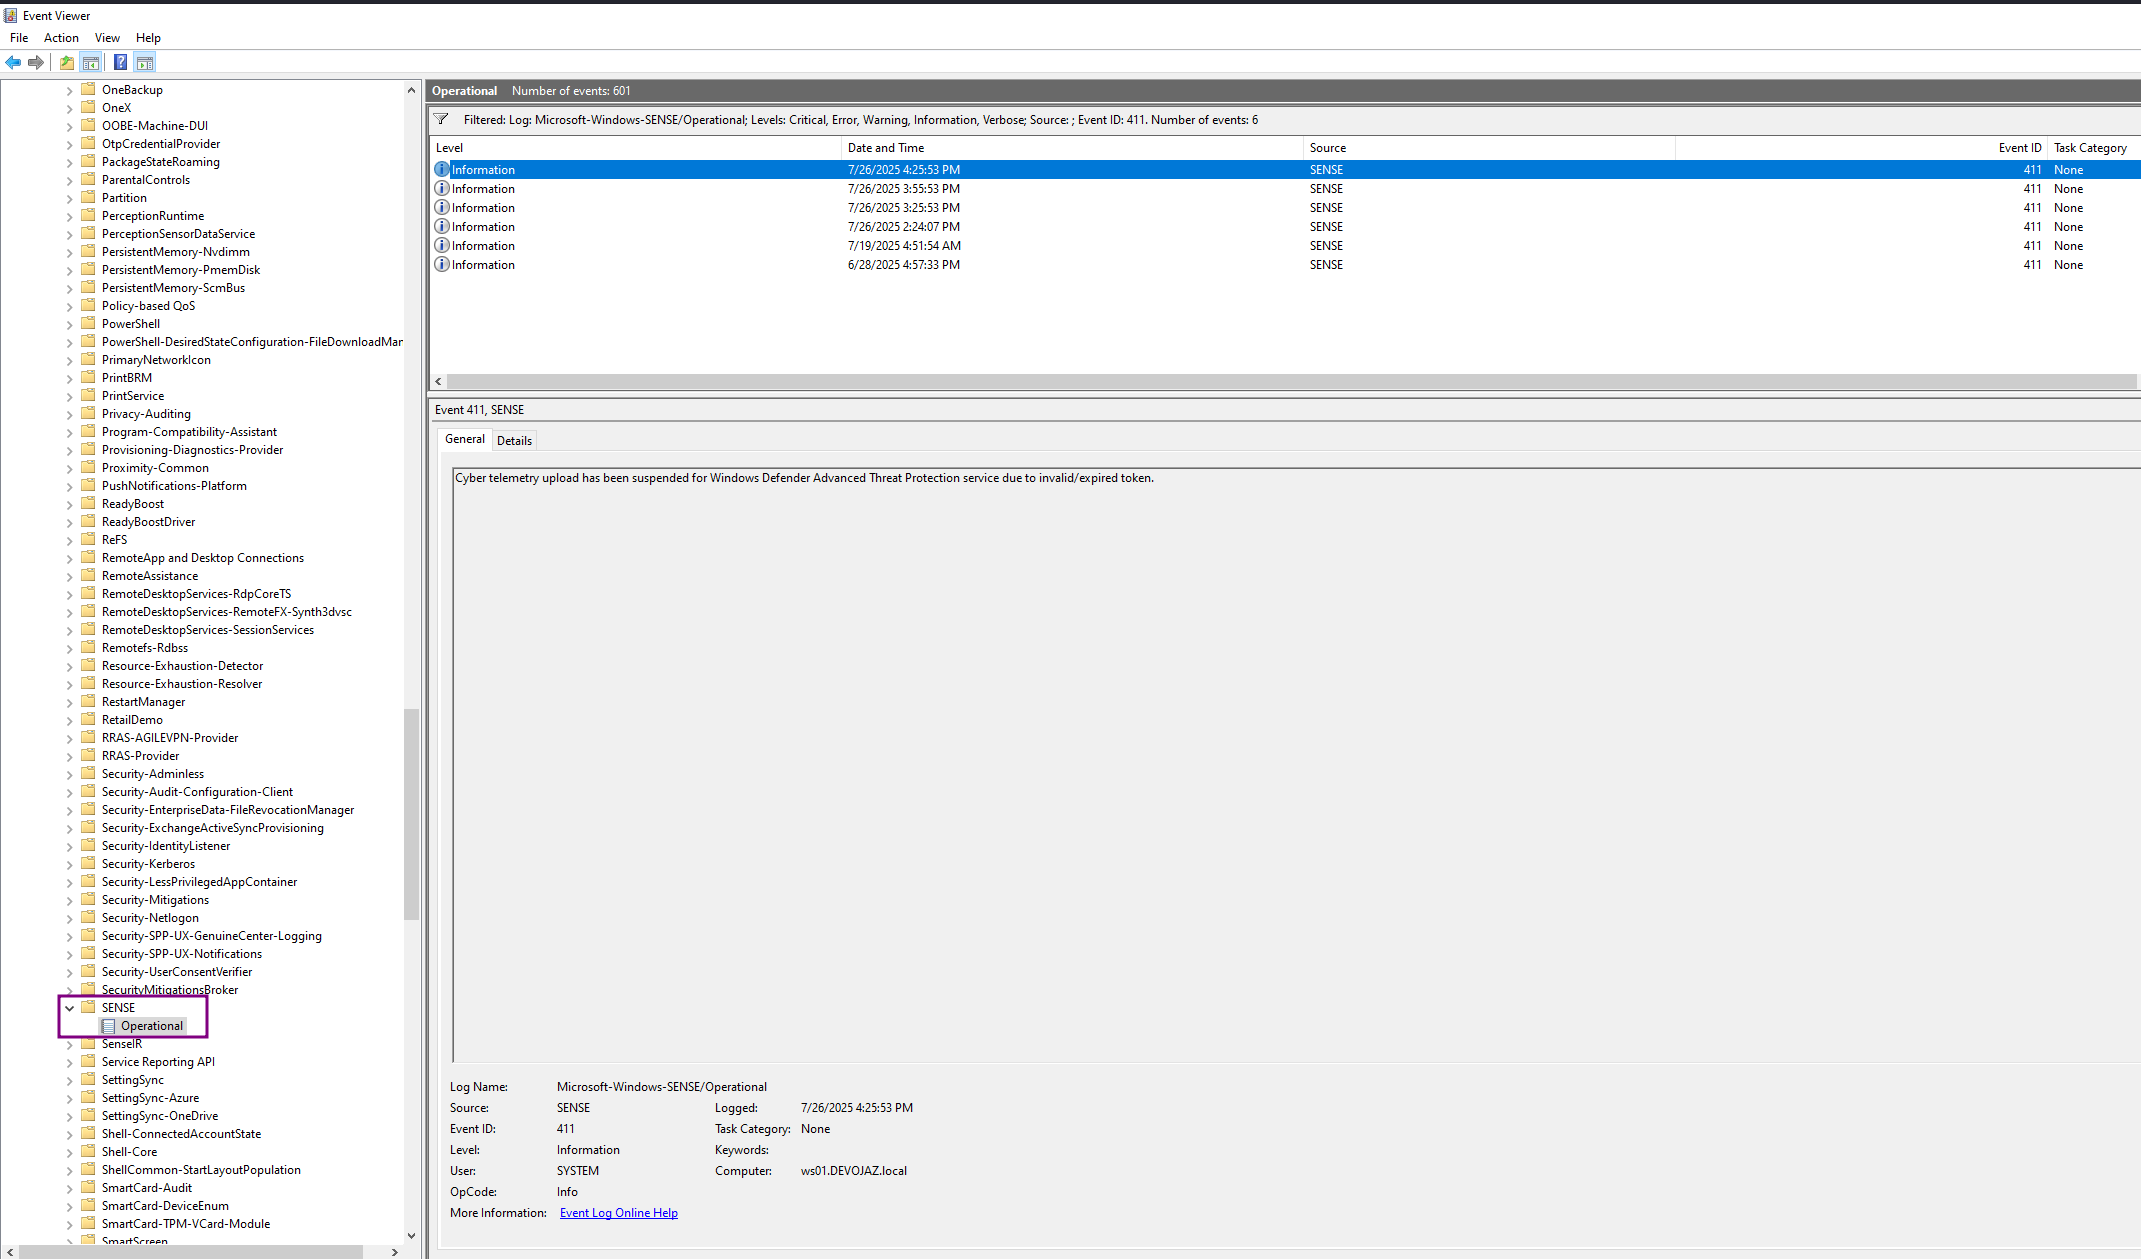
and they are 411 & 67 & 5
For event ID 411 - Cyber telemetry upload has been suspended for Windows Defender Advanced Threat Protection service due to invalid/expired token.
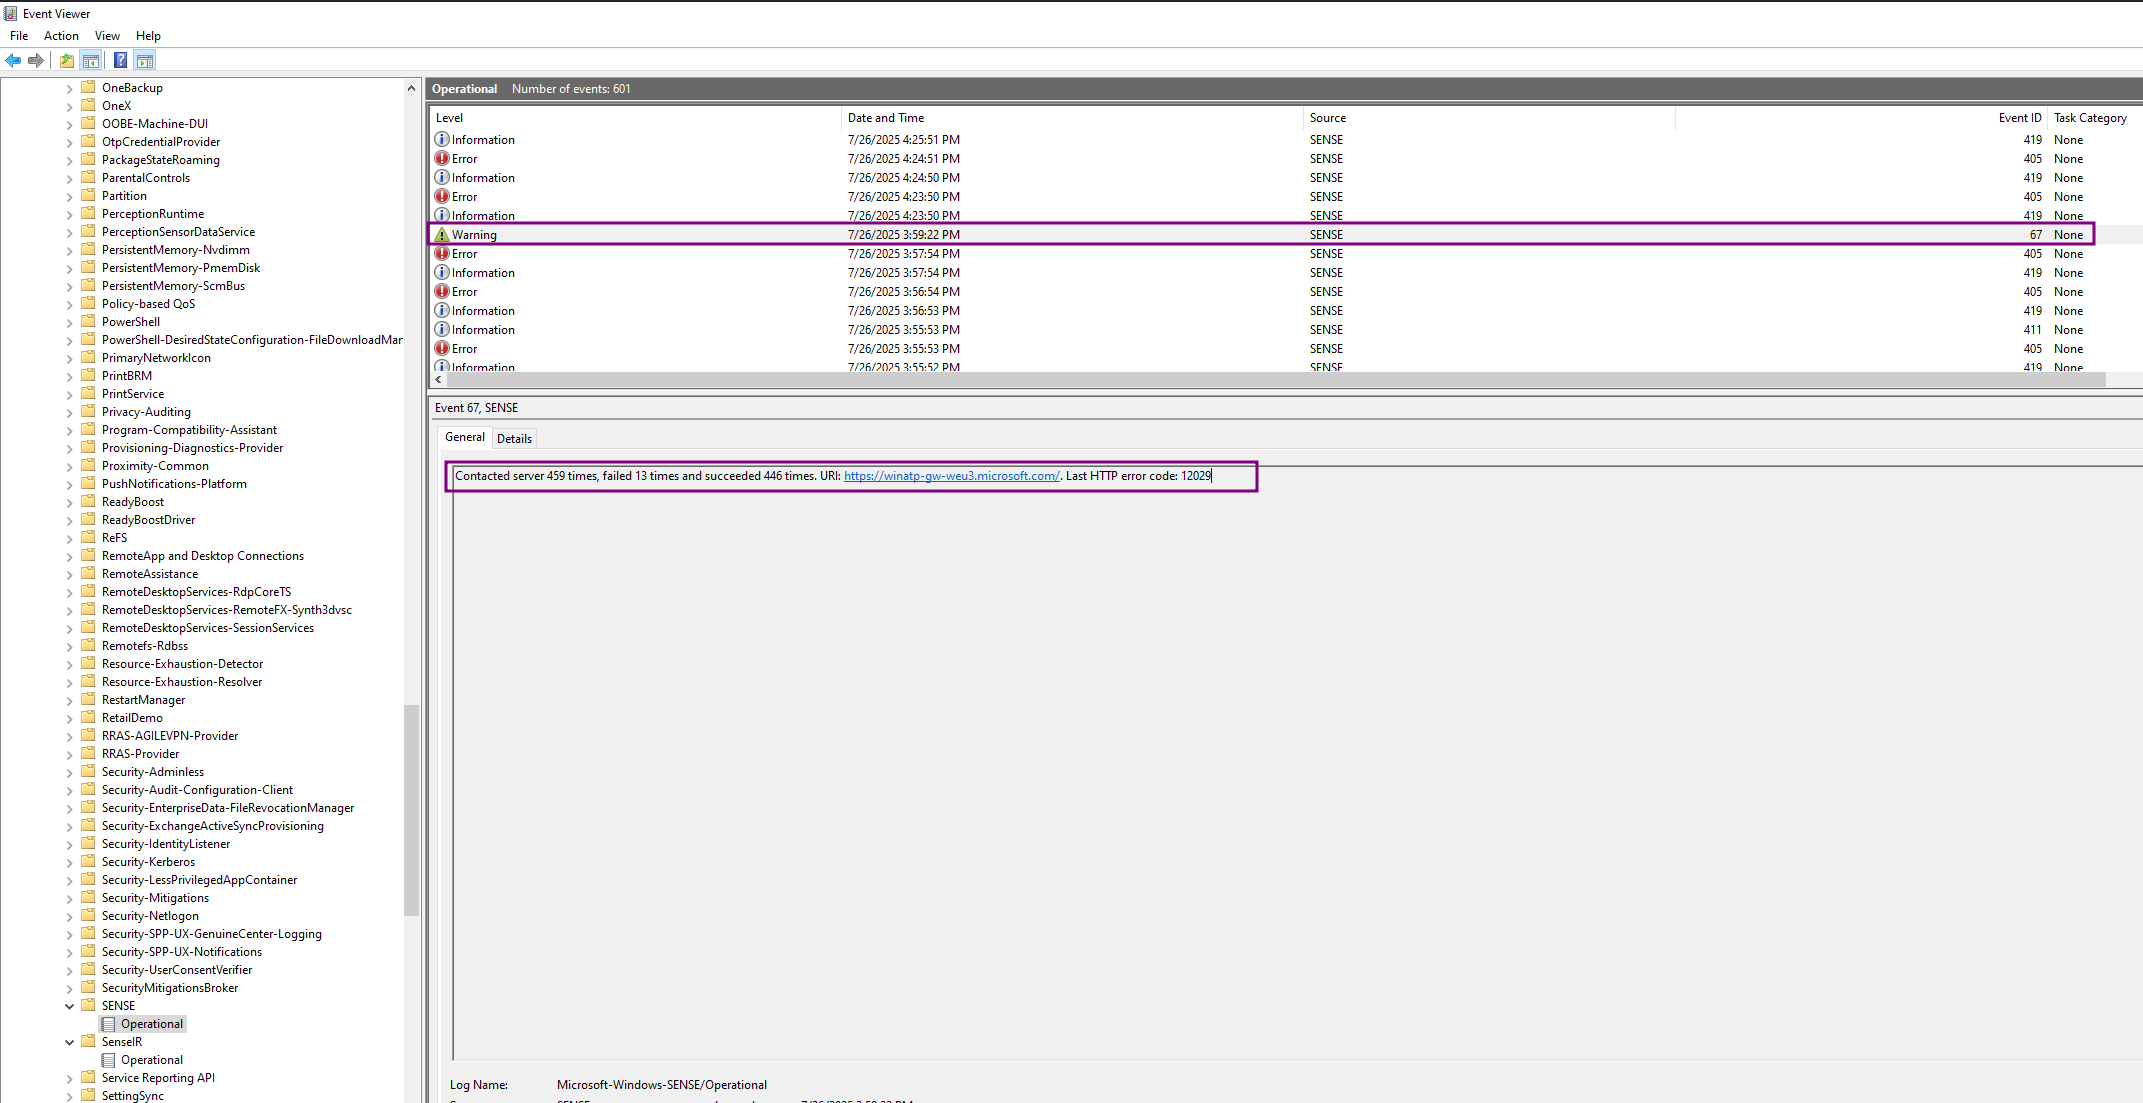
For event ID 67 - Contacted server 459 times, failed 13 times and succeeded 446 times. URI: https://winatp-gw-weu3.microsoft.com/. Last HTTP error code: 12029
For event ID 5 - Contacted server 119 times, all failed, URI: https://winatp-gw-weu3.microsoft.com/. Last HTTP error code: 12029
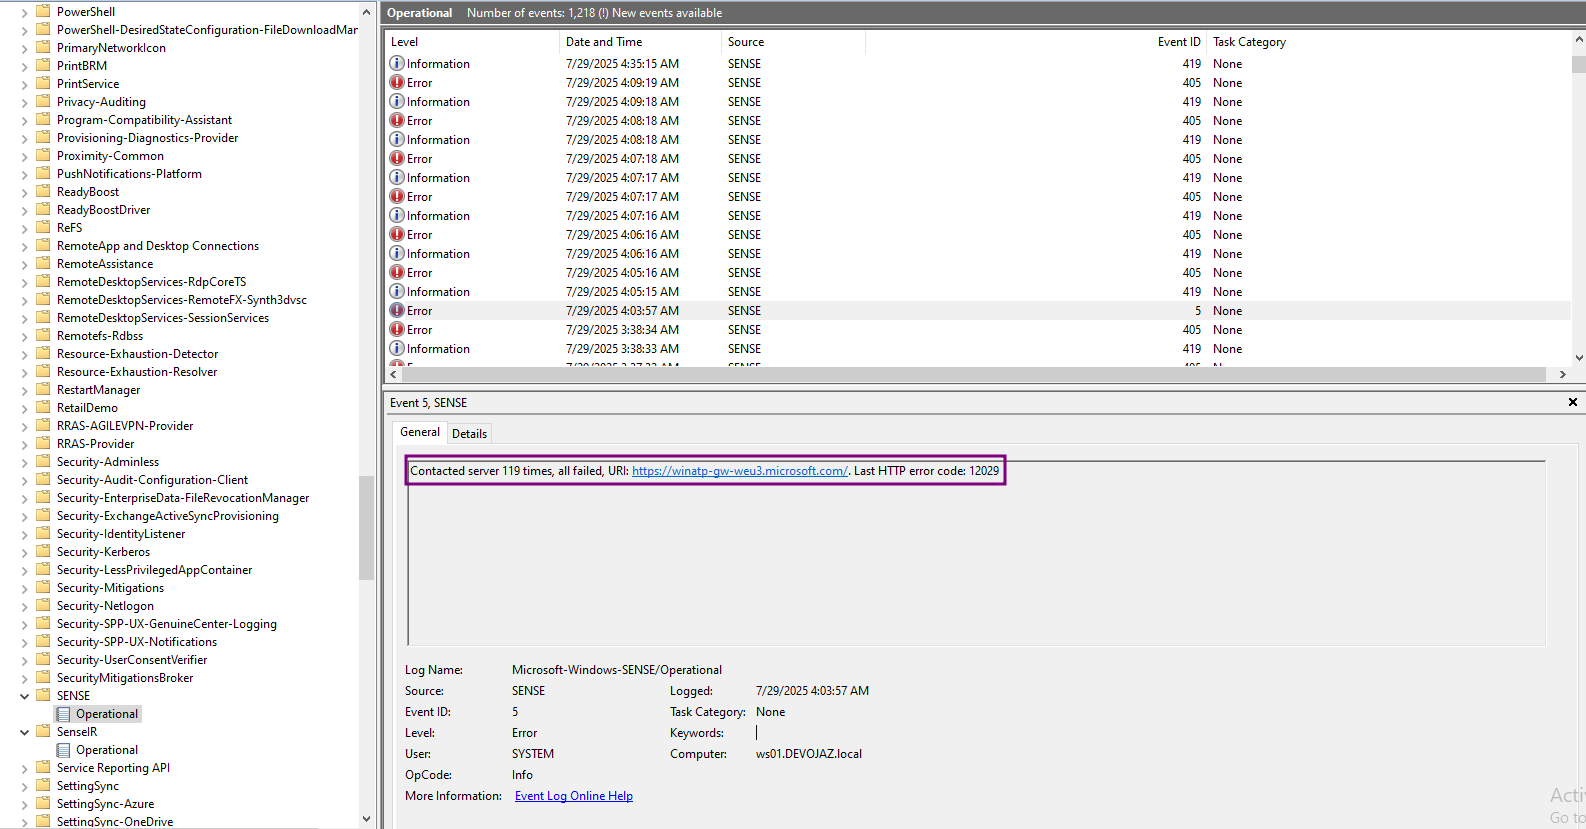
Both 411 and 67 were observed before, but never in these quantities during the two three-day experiment periods. However, Event ID 5 stands out it had never been generated before we started the EDR silencer, and it is rarely seen otherwise.
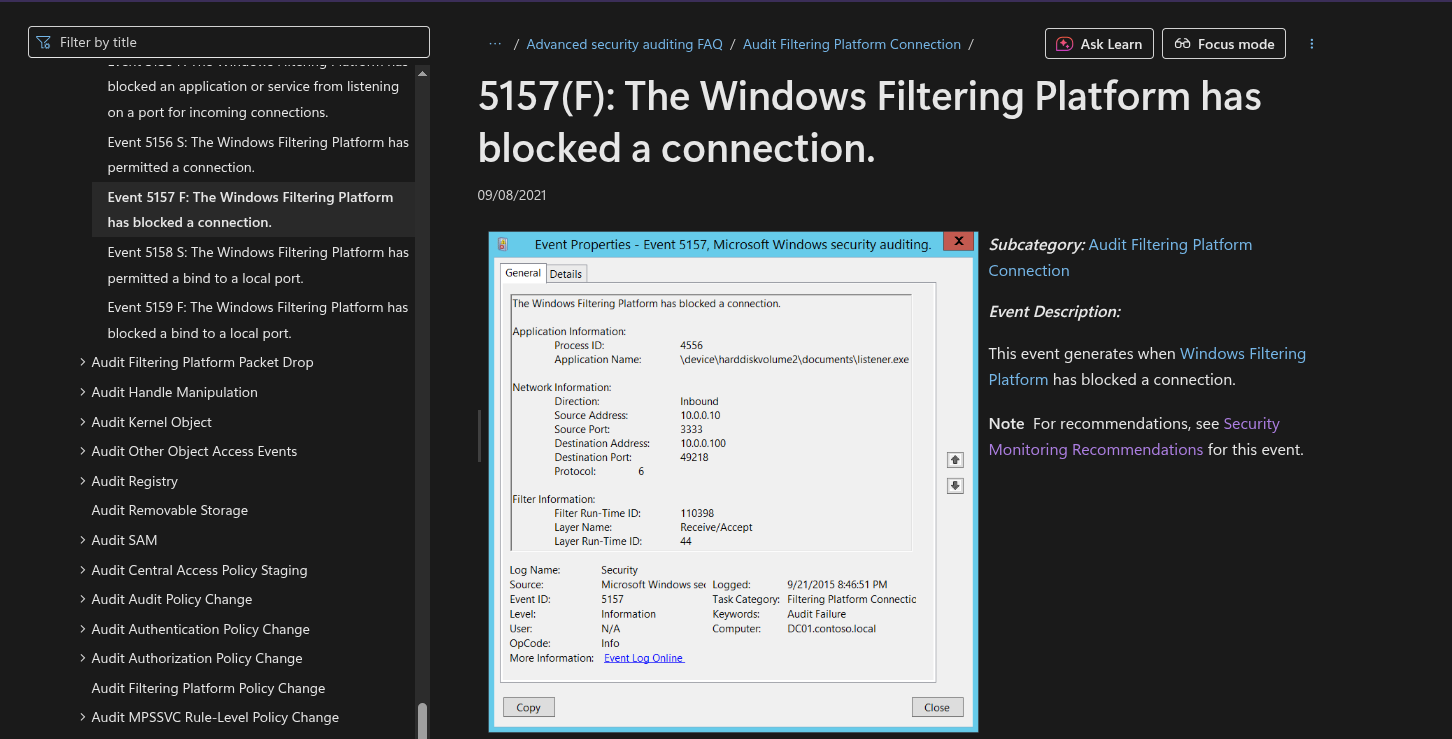
You can also check event ID 5157 The Windows Filtering Platform has blocked a connection, however this event ID is not enabled by default
As well as event ID 5447, which indicates a change to a Windows Filtering Platform filter
Once you restart the machine the WFP rules will be deleted, and the device will start sending logs again
DiagTrack Service#
DiagTrack is used to collect telemetry data, including Microsoft Defender for Endpoint (MDE) information, and runs under the process name diagtrack.exe.
Like most EDRs, they offload detection and correlation logic to a unified cloud platform. The endpoint’s role is mainly to collect raw telemetry, while the heavy analysis is handled in the cloud rather than locally.
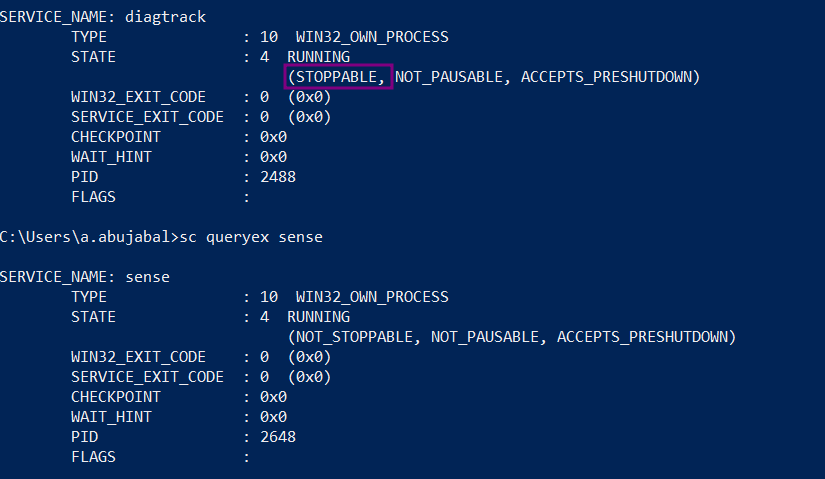
The Sense and DiagTrack services have certain protections in place. The Sense service is marked as NOT_STOPPABLE, while DiagTrack is not, meaning it can be stopped with:
sc stop diagtrack
However, Microsoft Defender for Endpoint (MDE) will restart DiagTrack whenever it needs to communicate with the cloud console.
It’s still possible to bypass this, but you’ll need to explore the method on your own.
Other Ways to blind the EDR#
There are many other ways to do this other than the couple used explained here like:
- Adding Firewall rules.
- Changing on the route table.
- Adding entries to the host to redirect MDE related FQDN to loopback.
Utilizing Logic Apps For Detection#
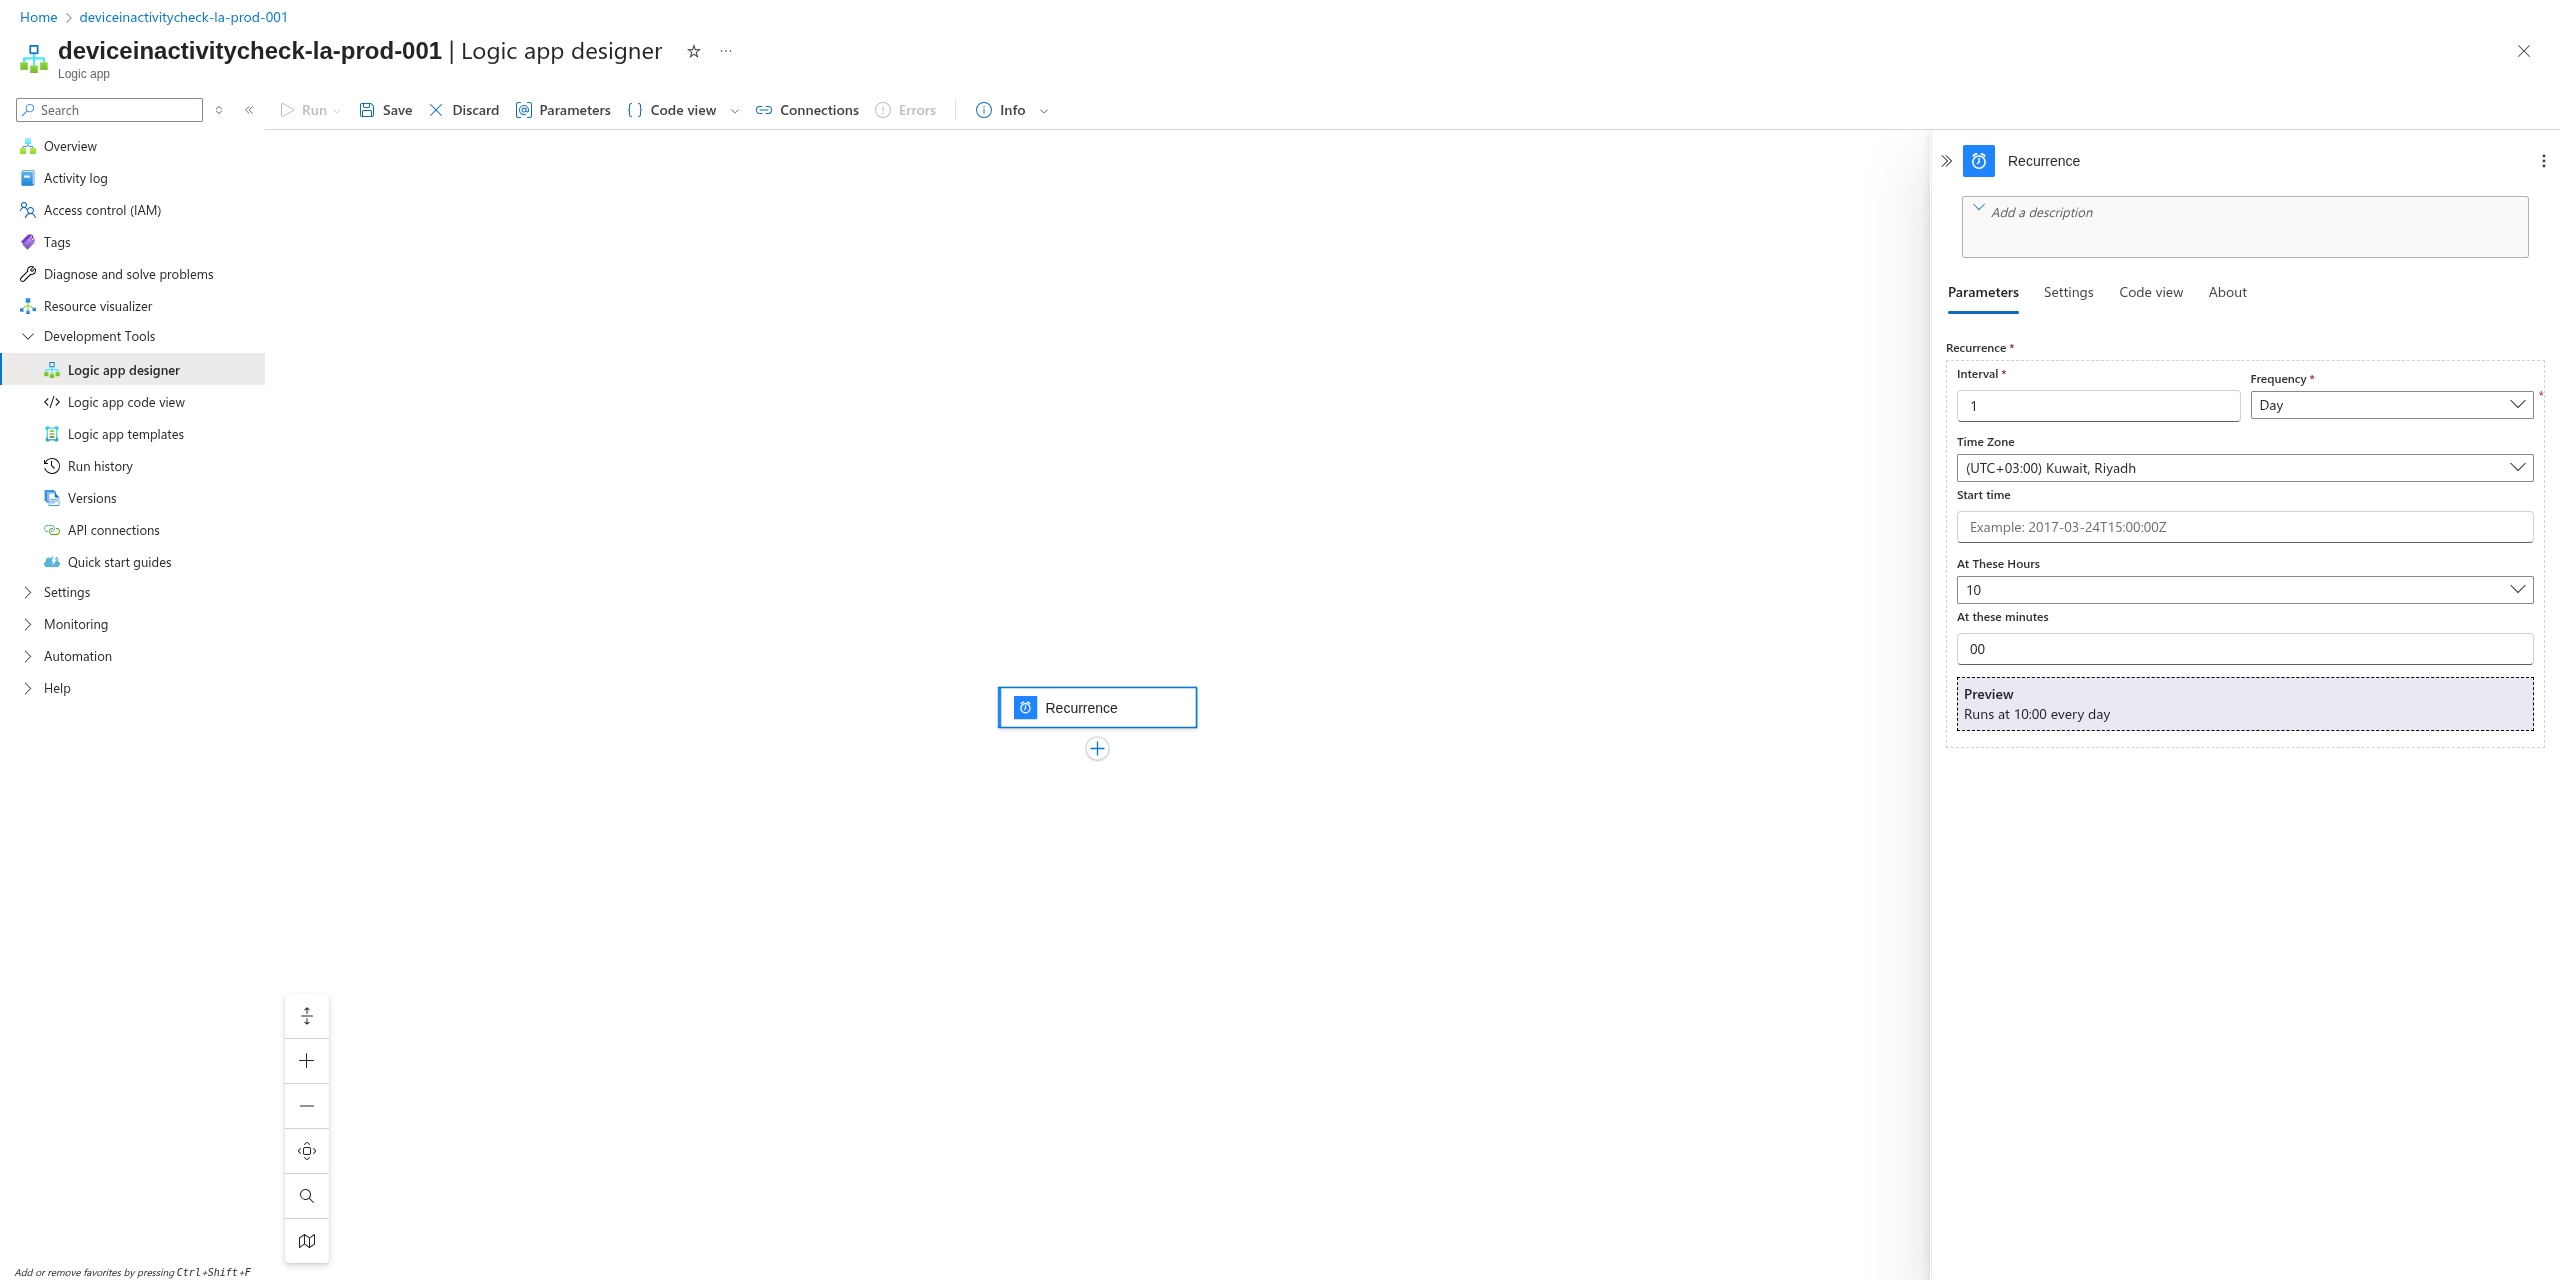
This is going to be a logic app to check the inactivity of devices by checking when was the last time a log was ingested.
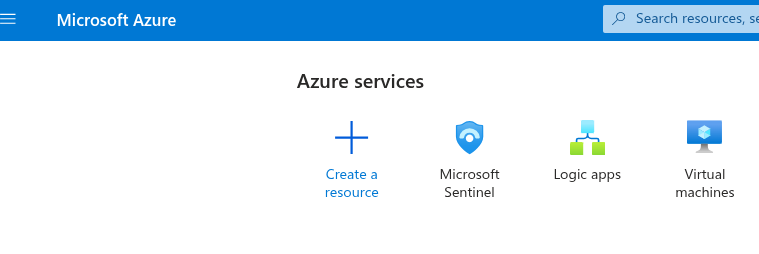
Go to Azure portal and search for Logic Apps
Then create a new one
Then add run query and list results, if this is the first time doing this you need to create a connection:
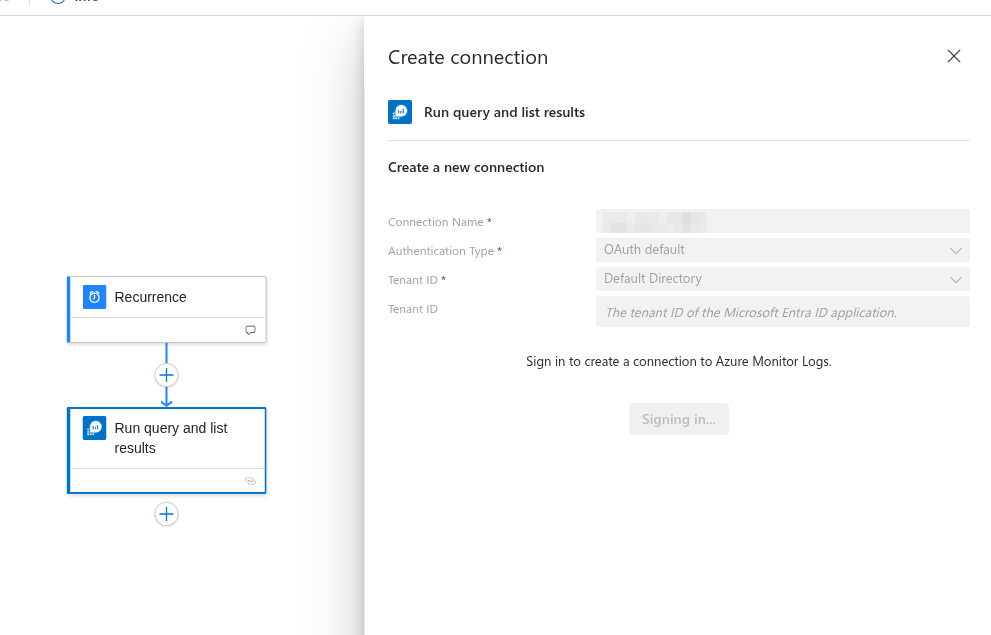
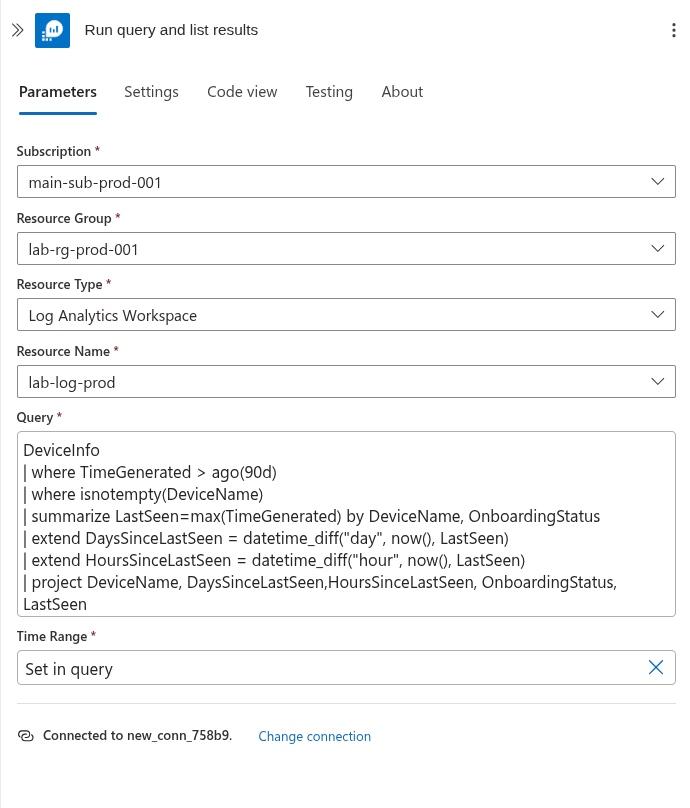
Then configure the subscription and resource group, specify the source for the logs where you are ingesting your MDE telemetry, and finally add the following query:
DeviceInfo
| where TimeGenerated > ago(30d)
| where isnotempty(DeviceName)
| summarize LastSeen=max(Timestamp), SensorHealthStates = make_set(SensorHealthState) by DeviceName
| extend DaysSinceLastSeen = datetime_diff("day", now(), LastSeen)
| extend HoursSinceLastSeen = datetime_diff("hour", now(), LastSeen)
| project DeviceName, DaysSinceLastSeen,HoursSinceLastSeen, SensorHealthStates, LastSeen
You can, of course, modify it to exclude devices whose last seen time is two or three times longer or more depending on your environment.
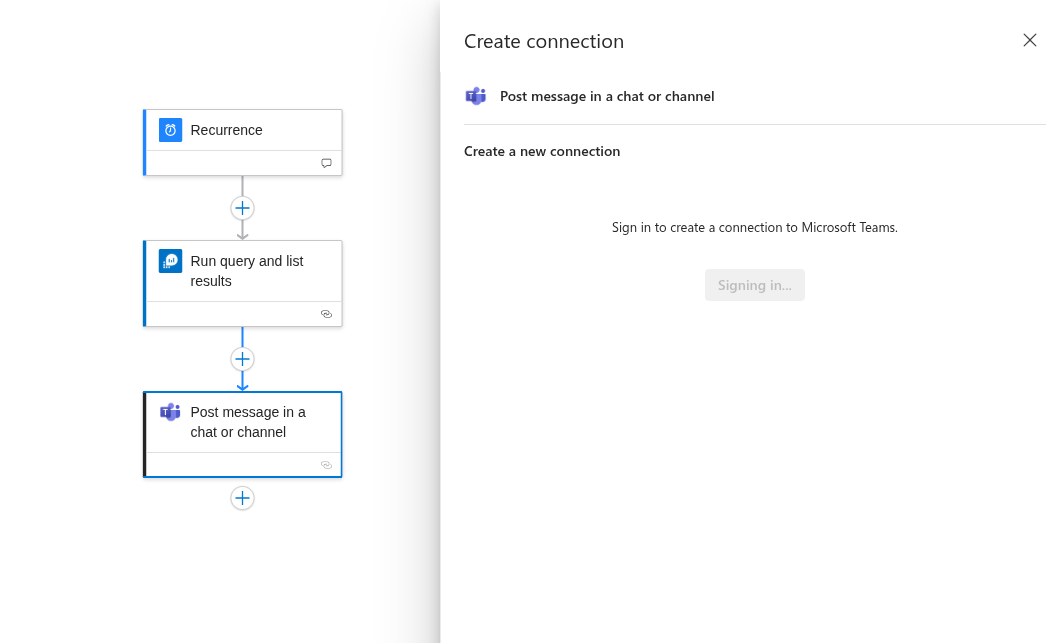
Then I want this to be posted in Teams so I can review it daily as a message.
You’ll also need to sign in with your account to enable it.
You might need to create a specific channel for these kind of insights from logic apps
For this you also need to get the channel link:
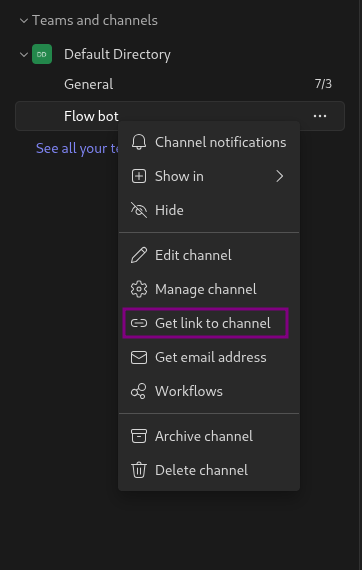
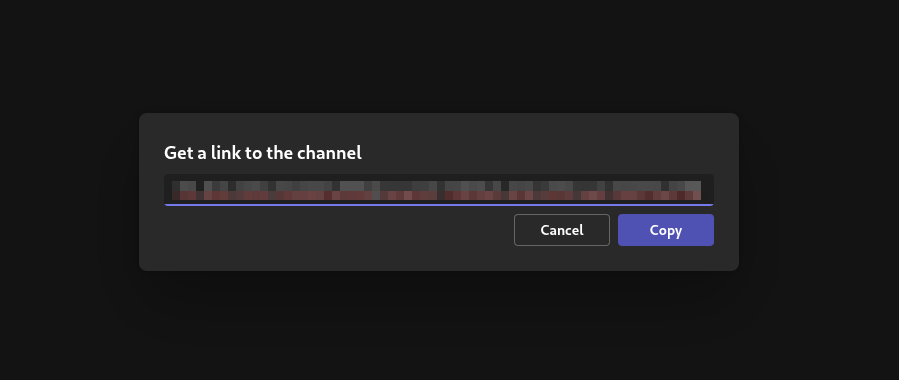
Next, go to CyberChef to decode the URL and extract the Teams channel ID.
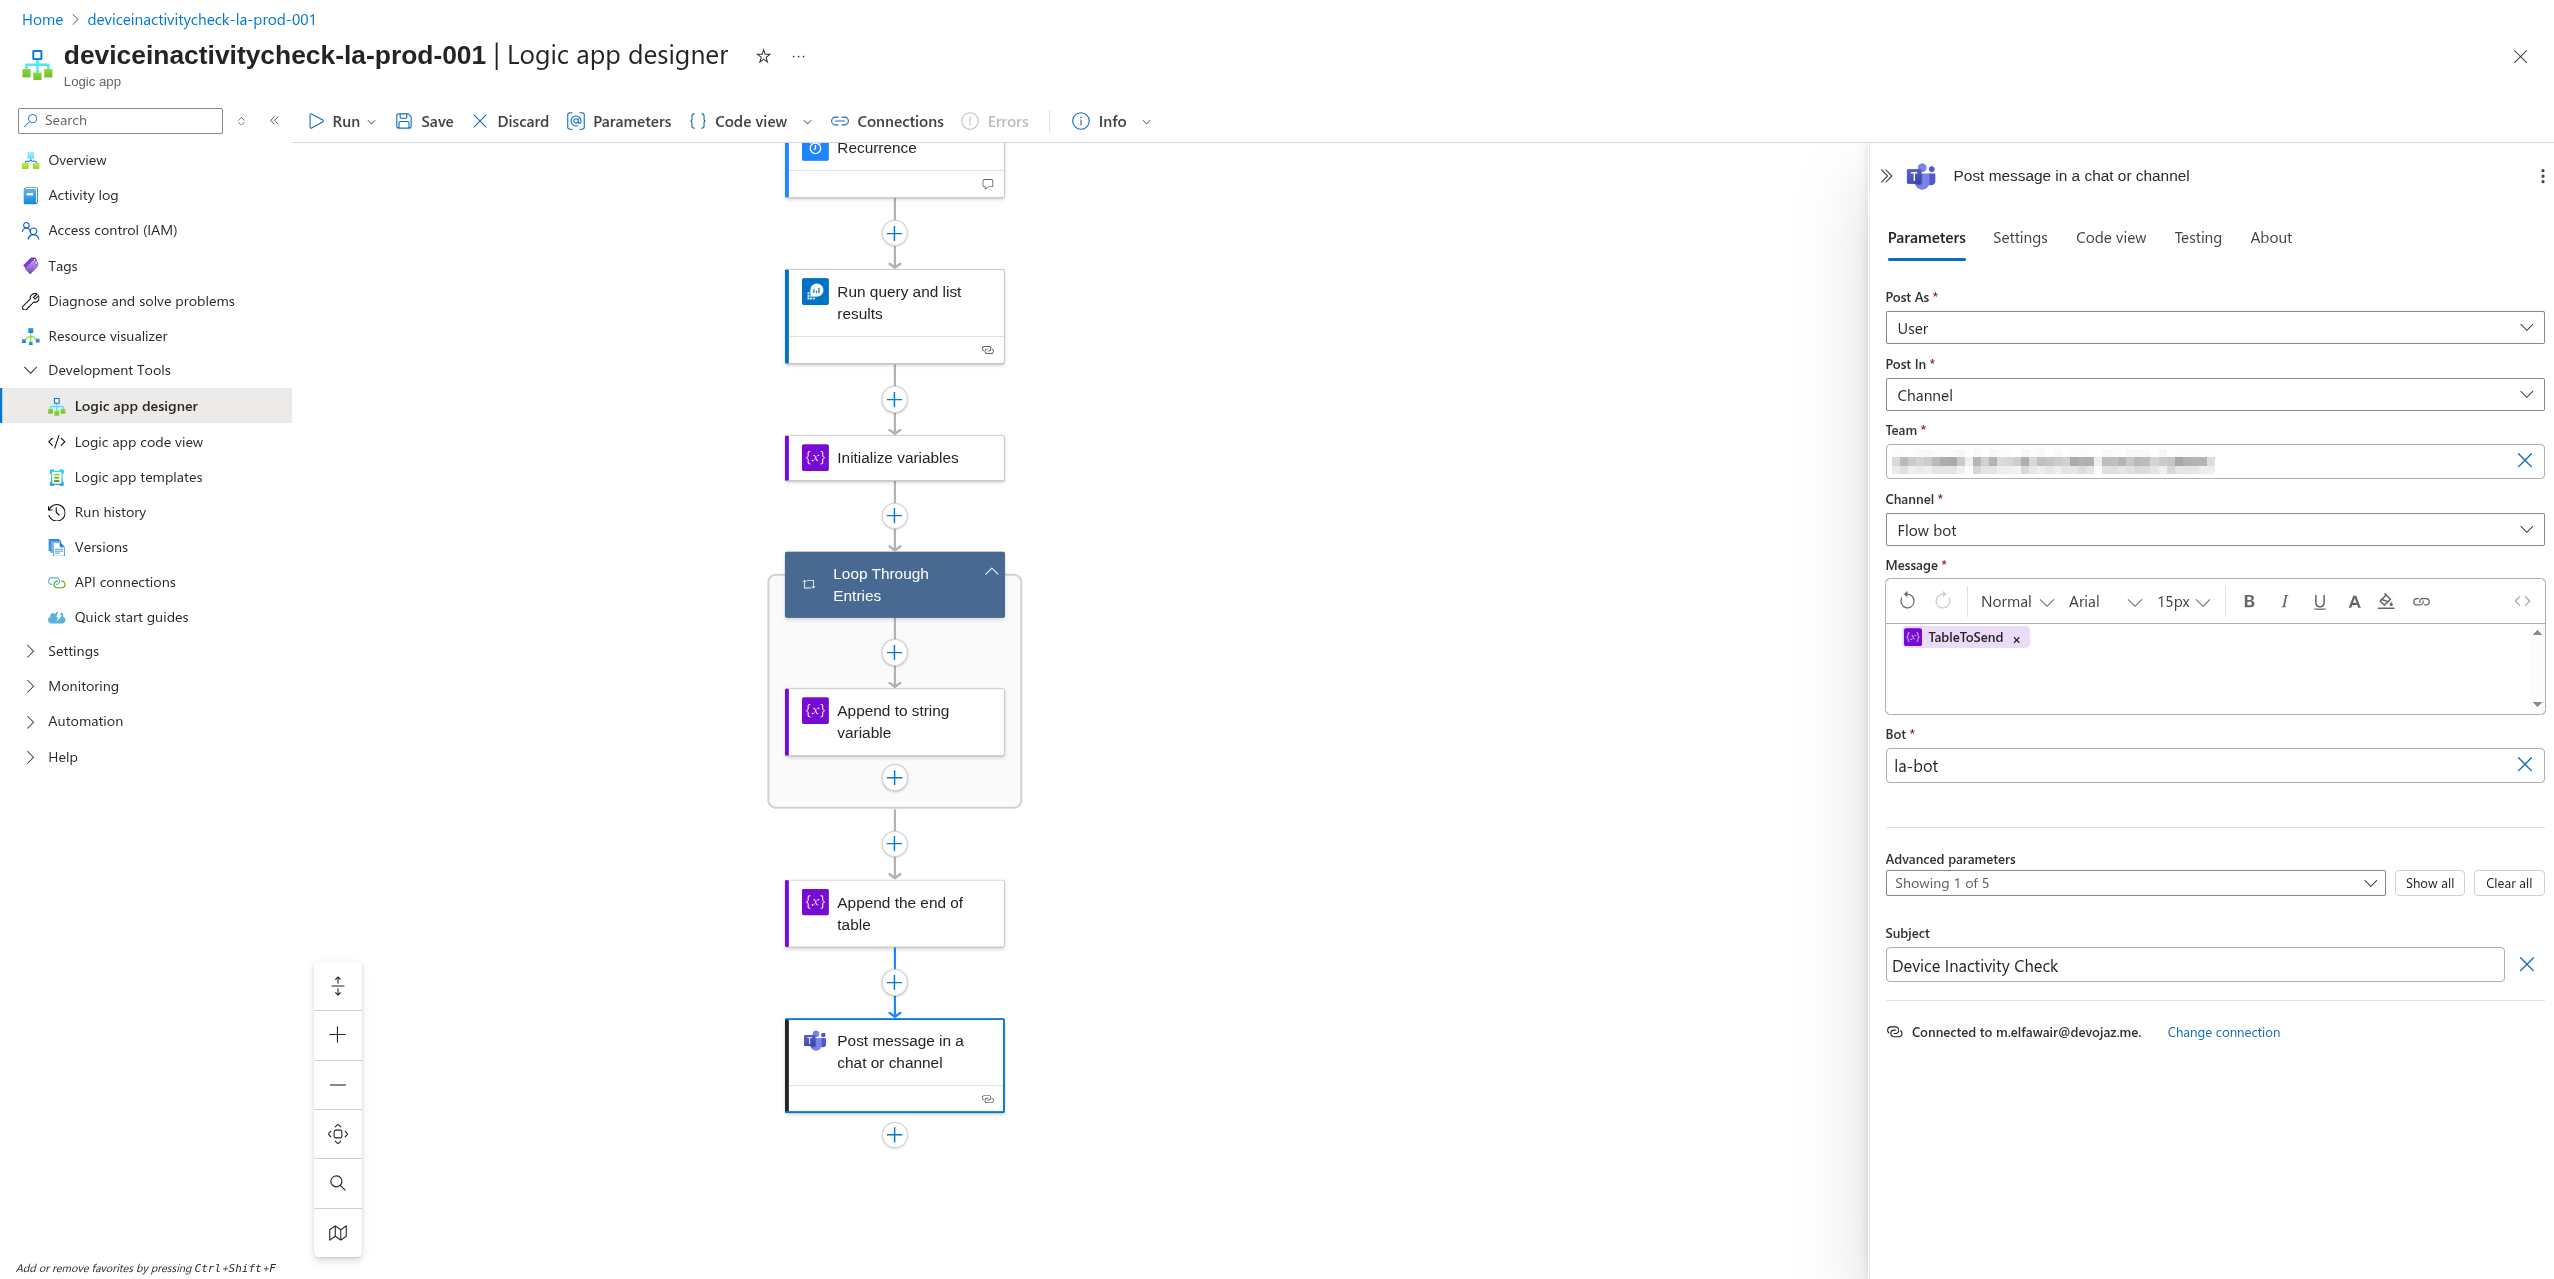
Now, let’s prepare the content for the Teams post, it will be an HTML table containing the data retrieved from the executed query.
First, initialize a variable to hold the table structure along with the necessary columns.
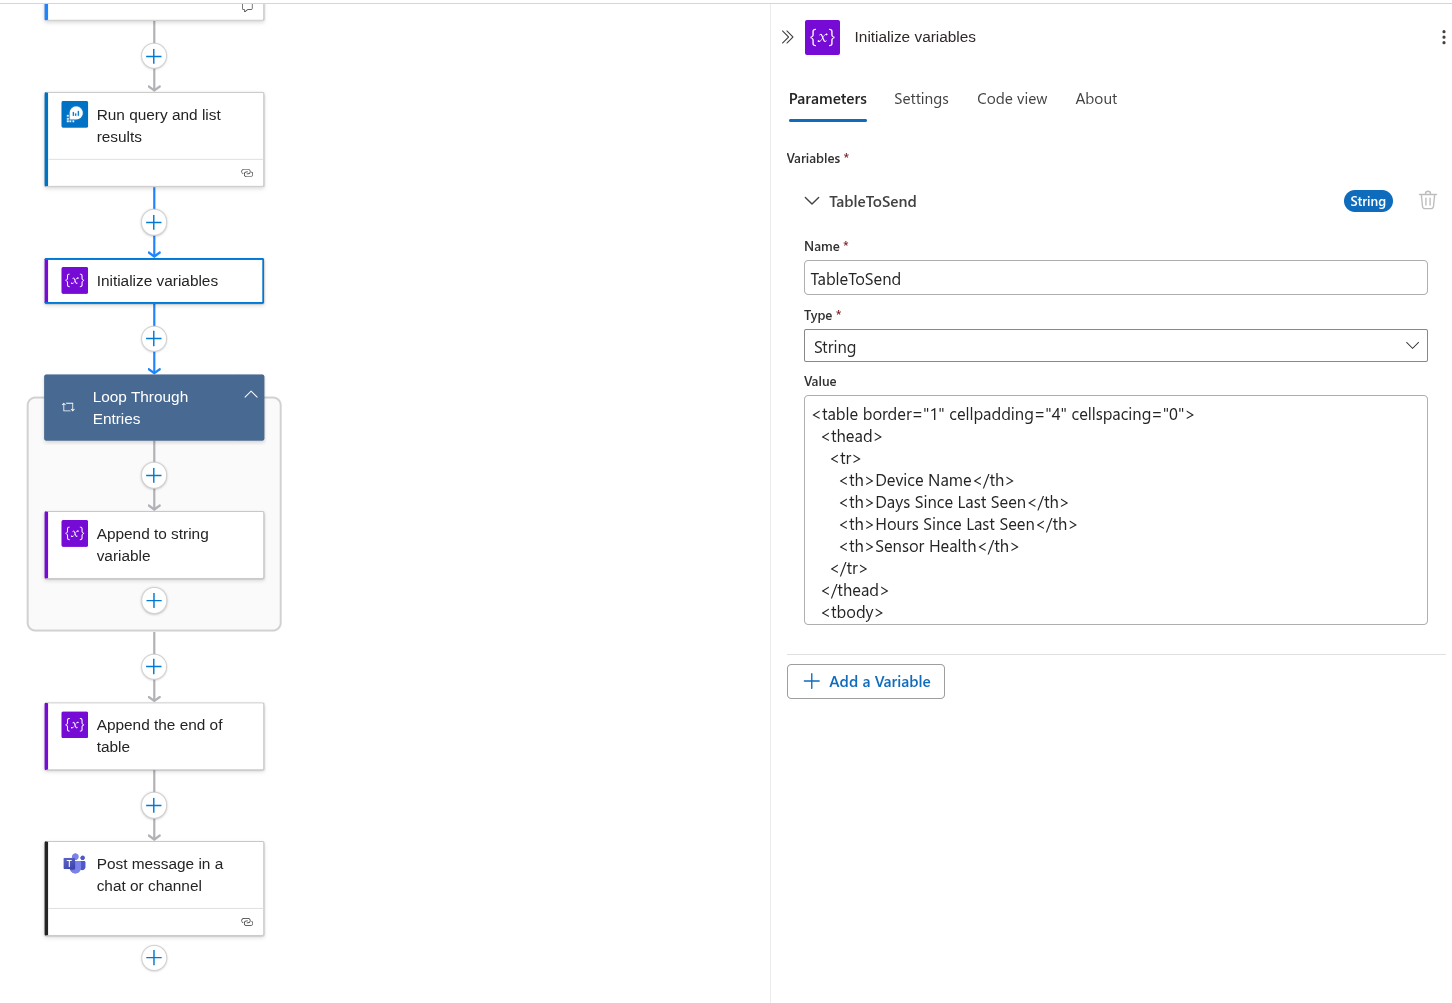
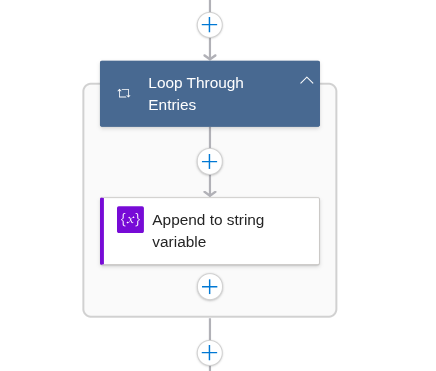
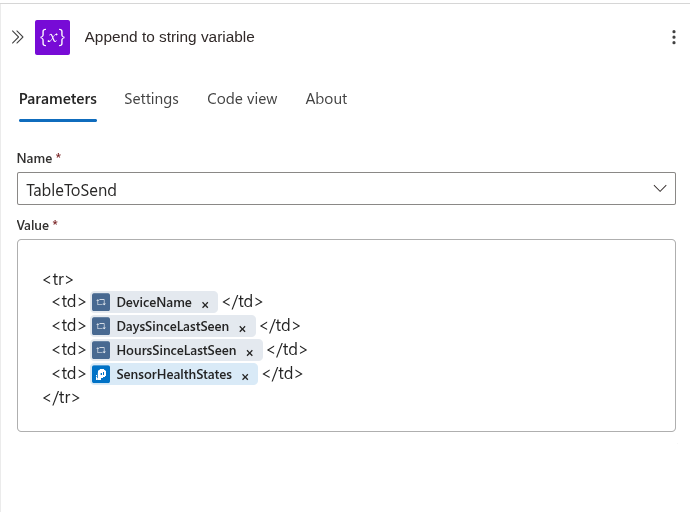
Then to get the data we will need for each so we can loop through the entries from the ran query and append them to the variable TableToSend
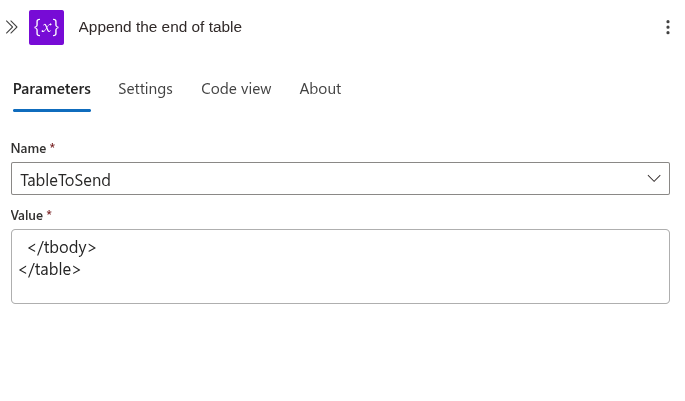
At the end we close the html tags.
Then set up the message with TableToSend variable and add a subject if needed.
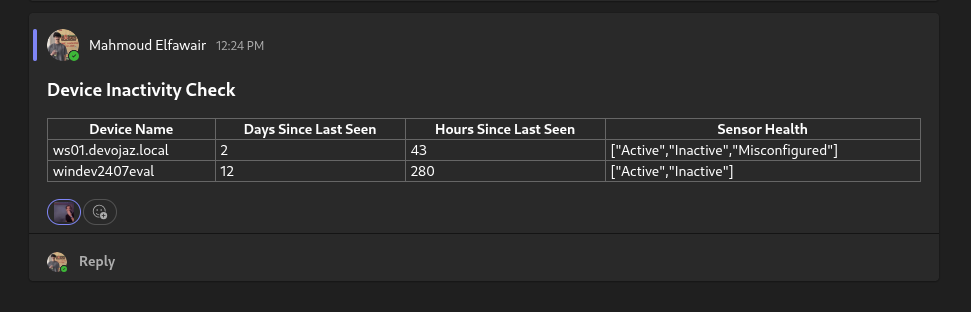
Now you are ready to go, you can run the logic app to test if it is working correctly and here is an example of the result:
Okey, you might be thinking, “I have many endpoints in my environment, this will generate too many results in the table.” And you’re right, it’s not practical to take all results as-is.
The key is to understand your environment, identify which endpoints have users with local admin rights (since this kind of attack requires elevated privileges). (In a mature environment, this number shouldn’t be very high, let’s say developers, sysadmins, IT… are they apart specific groups? if so, monitor those groups, or create a watch list for those devices and keep an eye on them.
Another good idea would be to create one for devices that you suspect and you start monitor them as well.
If you have a solid understanding of your environment, this Logic App will be highly effective for you.
Resources#
- https://www.3nailsinfosec.com/post/edrprison-borrow-a-legitimate-driver-to-mute-edr-agent
- https://medium.com/csis-techblog/silencing-microsoft-defender-for-endpoint-using-firewall-rules-3839a8bf8d18
- https://bhabeshraj.com/post/detect-addition-of-new-firewall-rules-in-defender-firewall/
- https://detect.fyi/detection-of-edrsilencer-120c34da5b0b
- https://learn.microsoft.com/en-us/windows/win32/fwp/management-filtering-sublayer-identifiers
- https://cloudbrothers.info/en/edr-silencers-exploring-methods-block-edr-communication-part-1/
- https://academy.bluraven.io/blog/edr-silencer-and-beyond-exploring-methods-to-block-edr-communication-part-2
End Blog#
Writing this blog took a lot of time preparing, researching other blogs, reviewing the source code of EDR Silencer, and even modifying its behavior to detect attacks. In the end, I realized that once this attack occurs, no logs will be sent to Sentinel. Maybe some MDE alerts might trigger if you use EDR Silencer without altering the source code to evade signature detection.
What this means is that the device will stop sending logs immediately after the attack runs. That’s why I believe monitoring devices with local admin privileges using the Logic App is valuable. If you know a device should be online but it stops sending logs, that should raise a red flag.
And this is it for today’s blog :3